It’s been a while since my last post, but we’re launching a new project, UK Tides, with Zooniverse, asking volunteers to help digitise sea level measurements from historical handwritten ledgers (https://www.zooniverse.org/projects/psmsl/uk-tides). The project focuses on two sites near Liverpool in the North West of England: Hilbre Island and George’s Dock – two of the longest records we have. The data will be used to study climate change and sea level rise and will be included in the Permanent Service for Mean Sea Level (PSMSL) dataset, which is used by the Intergovernmental Panel on Climate Change (IPCC).
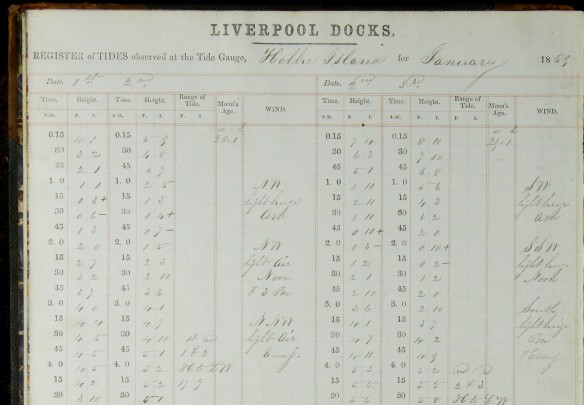
Handwritten ledger from Hilbre, 1853
Back in 2011, the British Oceanographic Data Centre at the National Oceanography Centre, won funding under the Jisc Mass Digitisation programme to preserve historical ledgers by scanning them. At the time, we investigated how we might actually digitise the data (https://historicsealevel.wordpress.com/2012/08/16/citizen-science-power-to-the-people/) but it wasn’t until Zooniverse launched their project builder in 2015 that we thought it might be possible.
Over the past 5 years, we’ve kept trying to rescue data but our efforts really were focussed in 2020 by the UNESCO sea level data rescue workshop (https://en.unesco.org/news/recovering-historical-sea-level-data-help-assess-risk-extreme-sea-level-events). One of the recommendations of that workshop was to “explore the feasibility of a pilot project for the Zooniverse platform for citizen science research” and UK Tides is the outcome!